It is very difficult to cover all of what you need to know about dyno testing in an article of this length, but perhaps I can take a swing at nailing some of the critical information down.
Dyno testing is an important part of engine development programs and can provide an improvement in quality control and horsepower as well. The real deal is always what you do with all the data that a modern dynamometer can collect. Hopefully this presentation will help you to understand what some of those numbers mean.
Effective dynamometer testing can improve the quality issues but can also improve your standing in the pecking order in the marketplace. Failure to test will most assuredly lead to a loss in standing in the long term. Develop. Refine. Improve.
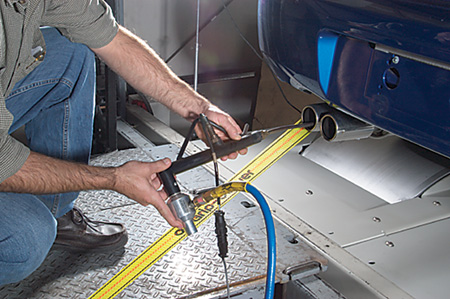
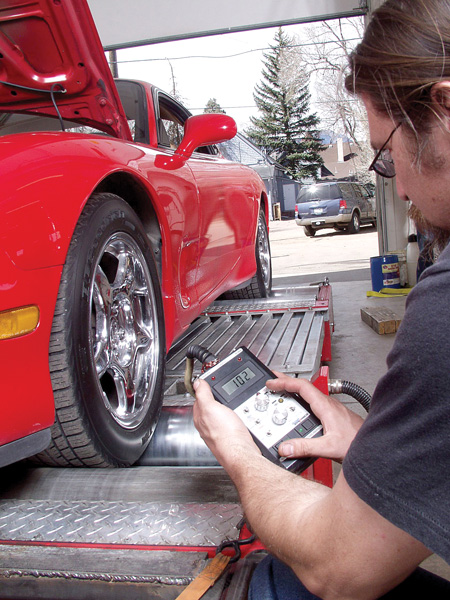
Whether you test on a chassis dynamometer or an engine dyno as long as sound procedures are followed the results should be usable in your development program. Although engine dynos are better for engine guys, chassis dyno testing is faster and easier for checking installed power.
Understanding Where The Numbers Come From
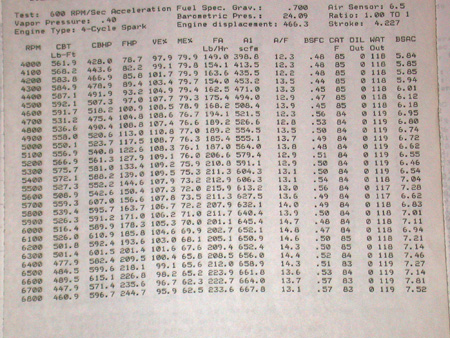
Reading a dyno sheet is fairly easy if you understand the terms and conditions of the test. There are some tricks to know in order to make some meaningful use of the data on a dyno sheet.
A graphic reference is always of assistance and can supply you with some very important information that otherwise would not be so readily apparent. A major advantage with some graphs is that you are able to see what may be more difficult to gather from a more columnar approach of data presented.
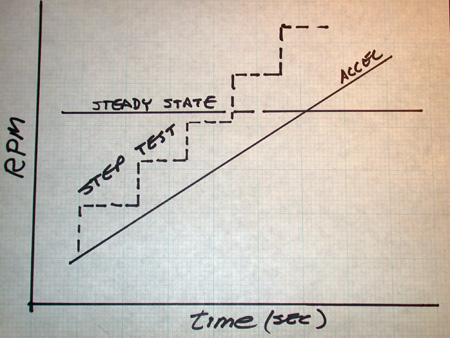
One valuable suggestion is to request of the dyno facility at least one graph of either speed MPH versus time or RPM versus time. Those graphs can tell you a great deal at the very first glance. If the RPM versus time graph is not a smooth slope, then the data on the test is probably not very reliable either. Variation in acceleration should not be more than a few percentage points.
Although the individual dyno manufacturers do not follow anything such as a standard format for presentation of the data; most at least use the same terms so that some common understanding is somewhat easier to accomplish.
Dyno Terminology
Type of Test – This becomes an important issue and is a piece of information that some dynamometer systems do not list automatically on the dyno sheet.
Acceleration test? At what rate? Steady State test? If it is not clearly stated or provided in the information on the dyno sheet, then you need to look at the data so that you can plot RPM versus Time or MPH versus Time on a chassis dyno.
Barometric Pressure listing refers to the local barometric pressure at the time of the test or at the data point. Mercury barometers are preferred for a local reference. This barometric pressure reading will not be the same as the local TV weather guys use. You must make sure that the barometer is reading local pressure.
Vapor Pressure refers to the amount of atmospheric pressure water is adding to the local barometric pressure. The vapor pressure is typically listed in inches of mercury (?Hg). The vapor pressure reading normally comes from a sensor that provides the data to the system.
When the vapor pressure is high it indicates that the amount of atmospheric oxygen is being displaced by some atmospheric water. When vapor pressure is low it is more favorable for making power. Dry air is denser than air that contains water. Remember this when track tuning.
RPM refers to the engine revolutions per minute and might have been collected from either a sensor on the engine ignition system or a counter on the shaft of the dynamometer or from a calculation if a gear ratio was in service during testing as on a chassis dyno. You need to know how the data was collected.
Vehicle mounted tachometers are not as accurate as dyno instrumentation (they are commonly +/- 5% of full scale) so remember that, too.
Torque refers to the twisting force that the engine or the drive wheels exerted. This is typically an observed condition if listed as the single word torque and is typically in lbs.ft. units. The torque value is usually measured with a strain gauge, but on some chassis dynos it might be a calculated number. You need to know which one was used. If the system does not have a strain gauge or a load cell, then it cannot be calibrated.
Horsepower is calculated from the basic formula and on engine dynos it is easy to verify. With some chassis dynos, the horsepower reference might be from some other calculation or measurement. You need to know which one was used here. On a chassis dynamometer the horsepower reference should only be at the drive wheel or “tire patch.”
There is not a reliable way to accurately estimate the power at the flywheel of the engine on a chassis dyno. Guesstimates perhaps, but not accurate. There are many variables in the drive train that affect power numbers.
Fuel Flow refers to the amount of fuel used at each data point and is typically displayed or printed in pounds per hour (lbs/hr). There might be more than one channel of fuel flow data available and that is convenient for connecting to a carburetor in order to evaluate the primary and secondary fuel flows on an individual basis. This also applies to EFI systems.
Air Flow refers to the amount of air used at each data point and is normally displayed or printed in either cubic feet per minute (CFM) or standard cubic feet per minute (SCFM).
SCFM is the reference to what the airflow would be if the conditions were 29.92?Hg, 60° F, dry air. Of course it is important to know what sensor and arithmetic created the number that you are looking at. There might be more than one channel of airflow data available for multiple carburetors or for systems that have high airflow demand.
The airflow can be used for helping supply data to effectively evaluate the engine as an air pump by looking at VE%, BSAC, and A/F ratio. It is typical that an engine will use approximately 1.25 CFM/Hp at peak torque and the same engine will use about 1.4 CFM/Hp at peak power.
BSFC refers to Brake Specific Fuel Consumption and is typically shown at each data point. The units are normally in pounds per horsepower hour (lbs/Hp-hr). This reference is essentially how efficiently liquid fuel is turned into horsepower. A common target for gasoline fuel is about .5lb/Hp-hr. Don’t get fooled into thinking that the BSFC number is either rich or lean. That is not correct and will lead to errors in analysis.
BSAC refers to Brake Specific Air Consumption and is displayed at each data point. The units are normally in pounds of air per horsepower-hour and indicate the use of air and how efficiently the engine made power with what it consumed.
A/F column refers to air to fuel ratio. This is normally the result of mass of air divided by how much fuel used at each data point. The A/F ratio is dependent upon which fuel is used and also on the rate of acceleration used as well as the response of the sensors. The steady state numbers will be different than those collected during an acceleration test.
Be cautious here in that the numbers displayed should be looked upon as a trend. If an O2 sensor was used, the number is as a result of combustion and is not a measure of how much fuel was supplied or how much air was supplied. You need to know which one was used.
Lambda (l) comes from a sensor mounted in the exhaust gas. It can be used as a reference to air and fuel mixture. Targeting the lambda value of 1.00 would be very close to a chemically correct ratio for the fuel being used and for gasoline the reference is 14.7.
For lambda numbers less than 1.00, the mixture is rich and for numbers greater than 1.00 the mixture is lean. Don’t get too focused on the numbers, but watch the trends.
VE% is Volumetric Efficiency. The normal way VE% is calculated is from the swept volume of the engine versus the amount of airflow that the engine has consumed. The best VE% will normally occur at the torque peak or very close to it.
Depending on how the airflow is measured, the VE% can go over 100%. Suspect the process, arithmetic, or calibration of sensors if the VE% is over 110% to 115% unless the engine is boosted.
If the VE% is high and the BSAC is also high, the air and fuel might be getting tossed out the exhaust and this data could be telling you to spread the LCA on the camshaft in order to better capture the flow.
Manifold Pressure is typically for reading the pressure inside the intake manifold. The sensor reads negative (vacuum) in inches of mercury (?Hg) and the positive side for blown applications is normally scaled to read in boost pressure in psi. The boosted readings can also be scaled in either bar or mm of Hg. For example, 1 bar is equal to 14.504 psi or 750 mm Hg.
Friction Power is data that can either be from motoring the engine or it could be from a table in the software. The table would be a look up chart and it would have a friction power value versus RPM of the engine. Friction power is the horsepower that it takes to spin all the engine parts to a particular RPM. The friction power curve is not linear and it is not the same for spark ignition engines as it is for diesel engines.
CBT is corrected brake torque that is corrected by some scheme to a condition of something other than the conditions were at the time of testing occurred.
CBHp is corrected brake horsepower that is corrected by some scheme to a condition of something other than the conditions were at the time of testing occurred.
CHp is corrected horsepower or this data might also be displayed in a format for chassis dynos. It is the power at the tire patch that is corrected to some other conditions other than that of the test. It is important to know which correction scheme was applied.
CT is corrected torque used for a chassis dynamometer listing. Corrected Wheel Torque is another listing. It is the torque at the tire patch that is corrected to conditions other than those of the test. If the chassis dynamometer was not equipped with a strain gage for measuring torque, then this value might have been back calculated from the horsepower number. Follow the numbers if you want to know how the corrected data was calculated.
ME% is called Mechanical Efficiency. This data is calculated by dividing the brake horsepower by the indicated horsepower (IHp). Stated mathematically, the expression for mechanical efficiency is ME% = BHp/IHp.This reference does not mean very much to performance-oriented people, but could help in an engine program that was working on fuel consumption.
BMEP is Brake Mean Effective Pressure and sometimes displayed and can be another way to evaluate the engine’s output. Units are in psi. The BMEP can be calculated by dividing 150.8 times the torque value by the cubic inches, which yields the BMEP in psi. Stated mathematically, it is BMEP = 150.8 x (Torque/cubic inches).
T/in3 or torque per cubic inch is reference found on engine dyno sheets and is a way to rate the efficiency of the engine. The torque is the brake torque divided by the displacement in cubic inches. A good guideline for well-tuned racing engines is a range between approximately 1.3 lb.ft/in3 and 1.5 lb.ft/in3.
Oil Temp is data that might also be expanded into oil temperature into and out of the engine. It is important to know where the temperature sensors are located in the oil system. Failure to run the engine in the best zone of oil temperature can easily swing the power results +/- 2% to 3%.
H2O Temp might be expanded into water temperature into and out of the engine. Again, it is important to know where the temperature sensors are located in the water cooling system. A pressurized system is often an advantage over non-pressurized because of localized boiling control on the coolant side of the combustion chamber.
Inlet Air Temperature is data that is also known as CAT or carburetor air temperature. It is important to know where the air temperature sensor was located during the test. In a well-controlled test, this number should not vary much from the start to the end of a test.
EGT may stand for exhaust temperatures or exhaust gas temperatures. The normal application on engine and chassis dynos is to use the type K thermocouple in direct contact with the exhaust gases. Note that most EGTs are slow to react.
The EGT numbers are typically a good way to look at intake manifold distribution problems. Normal differences in temperatures will range from 50° F to 100° F. If the temperatures are something like 200° F in variation, something is not correct. Normal EGT for gasoline = 1,200° F -1,300° F. The reference will also hold true for methanol or ethanol mixtures. It is suggested that you do not use the EGTs as an indication of either a rich or lean mixture.
Oil Pressure is typically shown in psi. It is important to know where the pressure sensor is located in the oiling system during a test. An oil pressure reading should indicate the pressure in the oiling system that is just prior to lubricating the engine bearings.
Blow-by is a column that is a reference for verification of ring and system sealing. A performance engine will typically show more blow-by at idle and low engine RPM than under load. Display units are typically in CFM. The sensors can be either electronic or mechanical and are typically scaled from zero to ten CFM. A well-sealed engine normally has blow-by in the vicinity of less than one or two CFM at maximum power. For sensors to operate correctly, it is necessary to seal off all breathers except the connection where the sensor is measuring.
Use Graphs To Understand Numerical Test Results
One of the easiest ways to look at a dyno run is with graphics. You can get a quick sense of what is going on by careful examination if you know a few things to start with. Modern dynos collect all sorts of data and you can get several sheets of data to evaluate after the testing is done.
Most dynos will allow you a computer disc of the tests that you had done on your combinations and that gives you a lot of latitude to look at the tests in detail after all the noise is over. Think about what was going on and how the data shows the results. The data will indicate things that are going on, but the data won’t tell you why something happens. You must learn to analyze the data.
Chassis dynamometer guesswork
If the power is increased or decreased, the loss that occurs in the chassis is not a fixed percentage of the changing power. The loss in the drive train depends on speeds, loads and temperatures. Competitive NASCAR vehicles on high-speed tracks have a loss of about 60 hp at 200 mph. It is not the same number at 100 mph. In drag racing vehicles, losses from 90 hp to 200 hp are common. How much the converter “slips” and the general inefficiency of the drive train has an affect on the results.
The torque to rotate a chassis dyno is a number that we could use for calculations that can be of some benefit in analysis of a rotating system. The bearing friction and the inertia of the roll are all part of the forces to overcome to get the roller to turn at different speeds. You need that kind of input data at several speeds in order to have reliable data.
The chassis dyno manufacturer should have supplied the Inertia data for that particular dynamometer as part of the calibration process. If they didn’t do so, then the numbers that you get from that dyno might be repeatable. There is not an easy way to prove specific accuracy. There are many things that you should be aware of when looking at chassis dyno test data.
In the game of testing, believe it only if you can prove it. And proving it more than once is the best proof. Final track verification of performance is the complete proof. Go to the track prepared from your test data.
If you are looking at a graph of dyno data for an engine, it is generally easiest to make sure the X-axis left to right is displaying engine RPM. If you are looking at dyno graphics from a chassis dyno, then the X-axis left to right should display vehicle speed. There are additional things that you might want to put on the X-axis, but start with the descriptions above.
The Y-axis should be listed as Torque and Horsepower and initially scaled so that torque and horsepower are using the same values.
If you see a dip in the curve data, what caused that dip? Take a look at the A/F ratio at the same point. If it made a move at the same time, you might have a problem with the fuel delivery system. Or it might even be where there was a momentary loss of data from the dyno data acquisition system.
The shape of the power curve will tell you a lot about the characteristics of the engine being tested. The same goes for a vehicle under test. If the developed curve is smooth on the rise to peak power and is also smooth past peak power, then the indication is that the engine is fairly smooth in power delivery.
What is the A/F ratio throughout the test? You should try adding some fuel in small increments and see what the result turns out to be. Remember that burning fuel produces power. Always tune to the safe side of rich fuel configurations.
If you have used an on-board A/F ratio device or a Lambda (l) sensor, then you need to reference the same number indications that made the best power across the range. IF you do that, it will make your racing experiences a lot better and more effective as well.
One final point that many people may overlook while at the track: remember to use the same fuel type as that which you tested with or you are not working with the same database of information anymore.
No matter what your results in the dyno room are, if you’re not using the same fuel, you can never hope to achieve the same results on the racing surface.
Harold Bettes is a dynamometer and flowbench test equipment consultant with more than 35 years of experience in working with these test devices. He is co-author of the Car Tech book Dyno Testing and Tuning. He can be reached at www.powertechnologyconsultants.com.