First introduced as a family back in 1990, these engines have been upgraded and improved to provide good torque for the necessary applications, reasonable fuel economy and a reputation for durability and appropriate performance.
Both have iron blocks and aluminum heads and since 2001 have been used nearly exclusively in Chrysler’s FWD?lineup, powering the Dodge Caravan, the Chrysler Town & Country and the Chrysler Pacifica. In 2007, the 3.8L became the optional engine in the Jeep Wrangler.
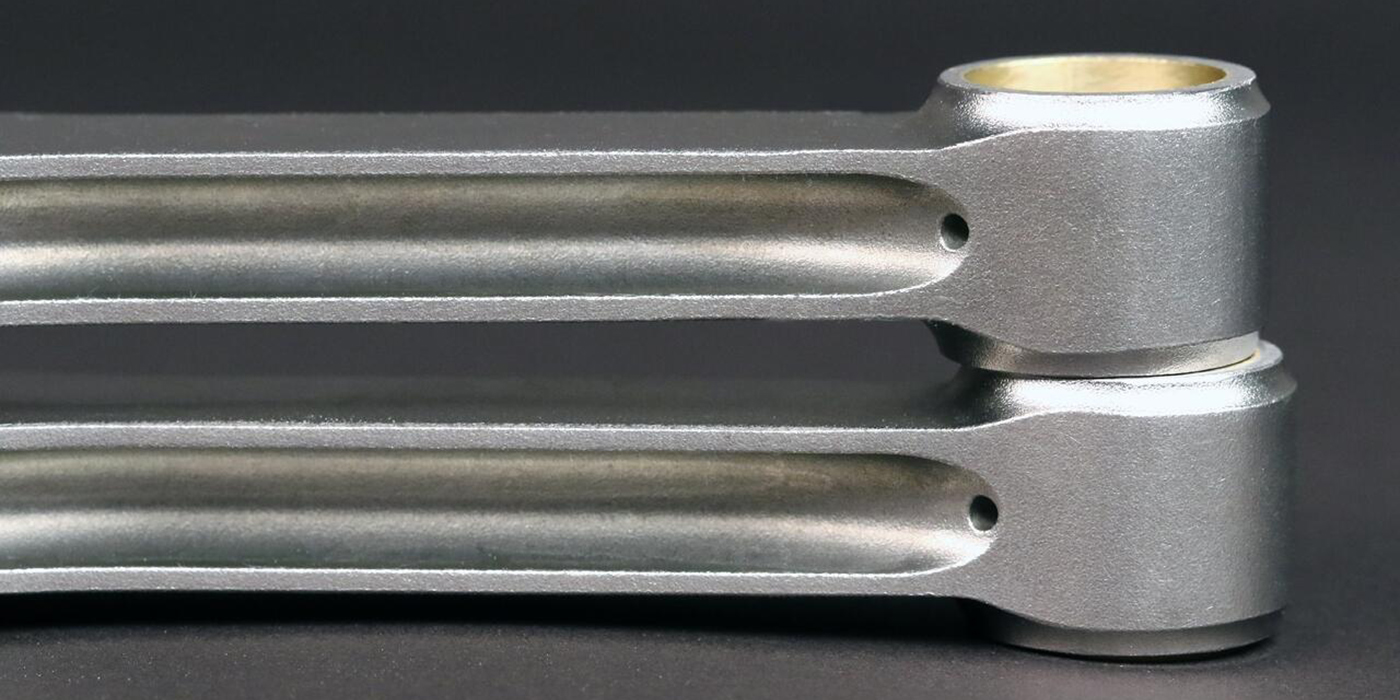
Although there are definite similarities, there are plenty of variations, too. Prior to 2001, Chrysler used the same block for both the 3.3.L and the 3.8L engine. Since that time there have been at least six different casting numbers for the 3.3L engine and at least four different 3.8L castings. Still, the main differences relate to parts, including different cranks, rods, pistons and camshafts.
In the March 2010 issue of Engine Builder, contributing editor Doug Anderson wrote an in-depth article outlining the parts and procedures necessary to properly rebuild these engines for continued service. Anderson says this engine is a good one that a savvy rebuilder should pay attention to.
“These engines have been around for a long time and have been used in a lot of high-value cars, trucks and minivans, so we can expect to see quite a few of them for some time to come. They’re easy to build if you pay attention to the details, so you should be able to make some money on them if you know the right combinations.”
It’s those details that are key. With multiple blocks, heads, cranks, rods and front covers, those combinations can be a little tricky. Likewise, details about the rebuilding costs can be tricky as well. Labor costs for different procedures may vary widely from coast to coast, and even from neighborhood to neighborhood.
As a supplement to that article, we present here our current labor costing study on rebuilding the Chrysler 3.3L/3.8L engine, which offers a look at national and regional average labor charges. The study covers various head, block and crankshaft service procedures as well as miscellaneous labor charges.
In addition, the detailed chart (see .pdf download) represents the national average, median and mode labor charges for all of the procedures covered in our survey.
As explained by at least one car advertiser in the past, your results may vary. Your shop’s operational procedures may allow you to be more productive than these charts indicate. Conversely, you may find your costs are significantly higher than others in your same area. These discrepancies should not be seen as indicating that your costs are either too high or too low.
Instead, they can be explained, says Bob Roberts, Market Research Manager for Babcox Research, in a variety of ways and for a variety of reasons.
“In some shops, certain operations may be included while doing others and this may lead to a larger dollar amount charged. Additionally, some shops may have given us an ‘each’ price when we wanted ‘all’ or they may have included an ‘all’ when we asked ‘price each,’” Roberts says.
“Some shops reported to us that they perform some repairs on a ‘time’ basis. We did not use a dollar-per-hour value if they provided it. A few shops price all their repairs on a ‘time’ basis. This is most common with welding repairs. Some shops do not perform all the operations listed and this leads to a smaller number of observations and thus a less reliable average,” Roberts says.
The “average” for a specific labor charge is the result of adding all of the charges for that service from all respondents and then dividing that number by the total number of respondents. The “median” is the result of ranking all of the survey responses from highest to lowest and then finding the number that falls exactly in the middle. The “mode” is simply the most-often reported number from all survey respondents.
Additionally, our chart provides the “95% Confidence Interval (CI)” range. In real terms, if you were to ask all of the machine shops in the country what their labor rates were for each operation, it is 95 percent certain that the “true” average labor cost would fall within this range.
In some cases, you’ll notice that the following charts include only? the national average. This is not a mistake, Roberts points out, and is instead a reliable representation of the results of our survey. “In all cases,” he concludes, “the national average will be the most accurate figure.”
For the complete survey with charts, please download the .pdf here.