For what seems like an eternity, it has almost become commonplace to wait for the eye roll, the shake of the head and the hangdog expression before hearing the familiar refrain, “Oh, man, let me tell you…”
In the engine building business, of course, the standard response industry-wide has, for many years, been simple:?Lousy. Numbers are down. Profits are down. Customer numbers are down. Everybody is depressed. On and on it goes. Numbers in our own annual Machine Shop Market Profile have, for the most part, borne those feelings out.
For nearly 30 years now, Engine Builder magazine has tracked this industry by surveying the same machine shop/custom engine rebuilder (CER) population. Because of the decades of data we’ve collected, we believe the information in this study is the most reliable data available for tracking trends in the production of engines, cylinder heads and crankshafts, as well as specific business data.
The data generated for this year’s Machine Shop Market Profile was collected through survey questionnaires sent to the machine shop/custom engine rebuilding membership of the Engine Rebuilders Association (AERA). Four different questionnaires, consisting of four pages each, were developed to obtain the information contained in our profile.
We mailed questionnaires to the membership of the AERA and contacted a random sample of Engine Builder subscribers with an email survey containing key questions regarding production. In all, we heard from nearly 220 locations that are performing machine work and building engines in the U.S. Analysis of the data was completed by Babcox Market Research.
The survey information reflects data for production year 2010. Part 1 of this two-part profile includes data on monthly production of engine blocks and cylinder heads, broken out by engine size as well as by gas and diesel configurations, crankshafts, core sourcing, shop equipment ownership and purchasing, and total production time spent in specific engine building areas.
Admittedly, participating in the Machine Shop Market Profile project is not the easiest way an engine builder could spend his day. The forms ask for a lot of information (all of it individually confidential, of course) and take some concerted effort to complete. All a recipe for disaster, right? Especially when everyone is struggling to stay afloat.
Well, as they say, a funny thing happened on the way to this year.
In many cases, those expressions seem to be a little less hangdog and a little more happy. It’s too early for the Engine Builder Brass Band to launch into a peppy rendition of “Happy Days are Here Again,” but continuing an exciting trend we noticed last year, it wouldn’t be inappropriate to say “Hmm. Things could be a lot worse.”
A report on a recent survey from the Automotive Aftermarket Industry Association (AAIA) and Northwood Institute indicates that aftermarket business leaders’ confidence in the overall economy has wavered in the past few months. Additionally, fewer of them currently report feeling significantly more confident about doing business in the industry.
Perhaps we’ve gotten used to negative news and have come to expect it. If that’s the case, it may be time to change our expectations.
From speaking with engine builders at recent trade shows, individually things seem to be better for many shops than they’ve seen in a long time. All things being equal, we are doing pretty well.
The results from this year’s survey show that many of the leading indicator numbers continue to trend higher than they were last year. And considering the hole we’ve been trying to climb out of, we think that’s great news.
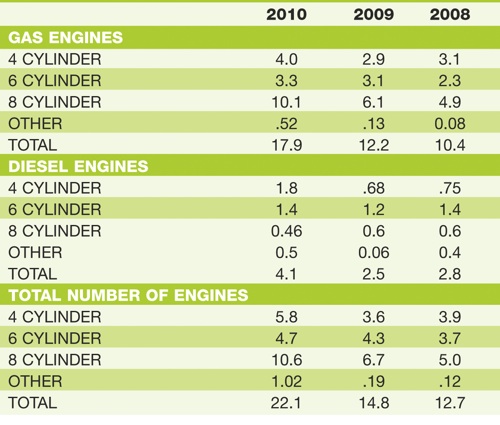
Nationally, the numbers look like this: the average machine shop produced 22 gas and diesel engines monthly last year, up from 15 per month in 2009, the highest number we’ve seen in several years; in fact, it’s the highest combined total we’ve tabulated since 1992!
Increases were seen virtually across the board. Four-cylinder and eight-cylinder gas engines posted gains of 28 and 40 per cent, respectively. The number of four cylinders produced climbed by slightly more than 1 per month while the number of eight-cylinder engines jumped from just over 6 per month to just more than 10.
Last year’s big growth market, six-cylinder engines, saw a more modest, but still respectable, 6 percent increase in 2010. The number of unspecified “other” gas engines climbed as well, from a yearly average of about 1.5 engines in 2009 to slightly more than 6 per year in 2010.
Overall, gas engine production increased 32 percent in 2010.
The diesel engine segment continues to impress, and more than redeemed its flat-to-down trend we’ve seen the past few years.
In all categories, the number of diesel engines increased from 2009 to 2010. An impressive 40 percent increase in diesel engines produced translates into nearly 1-1/2 more per month. Respondents say diesel engines account for just over 4 engines per month.
The average national monthly gas and diesel engine production of 22 units translates to 264 engines produced annually. This is up from the 180 reported last year, which compares to annual production of 180 engines produced during 2006 and 2007 for the typical CER. Again, you need to look back in our archives to see production numbers this high.
Projected onto a universe of 3,500 to 5,000 full-service machine shops, it’s estimated that CERs accounted for between 924,000 to 1.32 million gas and diesel engines built during production year 2010. Last year the market scope was 720,000 to 990,000 units.
If you add in the estimated 450,000 engines remanufactured annually by the approximately 30 North American production engine remanufacturers (PERs), the combined total number of engines rebuilt in 2010 by CERs and PERs would be approximately 1.37 million to 1.77 million units. This compares to approximately 1.17 million to 1.44 million engines produced by PERs and CERs during production year 2009.
The universe of shops has declined over the years. Because the universe of survey respondents changes somewhat from year to year, the size of the shop obviously plays a part in determining how many engines are produced. It’s possible that this year’s typical respondent is either bigger than those that responded in the past or has simply picked up business from shops that have closed.
However, as we pointed out last year, today’s “typical” engine builder is anything but. Not only are shops involved with a greater diversity of engines, niche market expertise has opened up a flood of opportunity with customers from every corner of the globe. Evidence of this comes with every interview we do with shop owners having an online presence. A customer base that used to be local is now regional, national or even international. Access to the Internet and online marketing and sales technology has made U.S. engine builders truly worldwide suppliers.
At an average retail cost of approximately $2,600 per engine, we calculate that the total rebuilt/remanufactured engine market generated between $3.56 billion and $4.6 billion in rebuilt engine sales in 2010.
By breaking the engine building business into five basic categories of actual machining processes – production of short blocks, long blocks, complete engines, cylinder heads (not used on long blocks or complete engines) and crankshafts (also not used in long blocks or complete engines) – we asked shops for the percentage of business they did in each. In gas engines, the percentage of production of short blocks, heads and crankshafts decreased.
Long blocks and complete engines became a bigger part of the pie. In 2010, these two categories accounted for more than half of the typical shop’s gas engine production. Cylinder head work, though it declined somewhat, remains the single biggest part of the typical rebuilding business.
For diesel engine builders, long block production jumped dramatically, from less than 10 percent of the typical shop’s production to nearly a quarter. Heads, complete engines and crankshaft service fell in our survey.
On a national basis, combined gas and diesel cylinder head production increased nearly 20 percent, climbing from a total of 44 units rebuilt monthly in 2009 to 55 units rebuilt monthly in 2010.
Gas head production increased about 12 percent, going from 36.4 units monthly in 2009 to 41.3 units produced last year. Across the board, the numbers were up: four-cylinder head production saw an increase of 20 percent; six-cylinder production increased 7 percent and eight-cylinder head rebuilding was up 6 percent over 2009.
Diesel heads rebuilt monthly saw an entirely positive trend, reversing slight declines seen last year. Total diesel cylinder head production climbed from 7.5 units rebuilt monthly in 2009 to 12.8 units in 2010, an overall 41 percent increase.
Four-cylinder diesel head production increased 44 percent; six-cylinder diesel head production climbed 50 percent; eight-cylinder head production increased a “modest” 16 percent over 2009 numbers and “other diesel cylinder heads” climbed 50 percent, from .3 cylinder head per month in 2009 (or 3.6 per year) to .6 cylinder head per month (7.2 per year) in 2010.
The percentage of cylinder head rebuilding that is aluminum fell slightly in 2010. In 2007, 48.9 percent of cylinder head work was done in aluminum; in 2008, 56.3 percent of repaired cylinder heads were aluminum, and the 2009 results show that 58.1 percent of cylinder heads rebuilt are aluminum. The 2010 results show that 55.5 percent of cylinder heads are aluminum. We attribute much of this not to a significant decline in aluminum cylinder heads but to an increase in cast iron diesel heads.
As with complete engines, General Motors continues to dominate in the cylinder head rebuilding market, according to our survey respondents. Even though his share fell somewhat, The General still wields the biggest stick in the fight. When asked what the number one cylinder head rebuilt in their shop was, 60 percent named a GM product.
However, other brands are making their presence felt as well. “Other” types of cylinder heads remain in second place with 10 percent of shops naming any one of several heads as their top product. Ford remained in third place with a slightly higher number than last year’s survey: Ford was named Number 1 by 8 percent of rebuilders.
Chrysler climbed in popularity, according to 2010 survey respondents. Mopar was ranked Number 1 by 6 percent of rebuilders, up from 2 percent last year. However, Honda’s popularity declined, with 3 percent of rebuilders naming Honda Number 1, down from 5 percent in 2009.
Last year’s big surprise involved Toyota: Adding to its considerable aftermarket woes, Toyota cylinder heads were not named as No. 1 by any shop in 2009. While the numbers this year don’t seem to be much higher, at least the percentage increase of 100 percent (up to 1 percent from 0 percent) is impressive.
Respondents tell us that the percentage of cylinder head rebuilding that is diesel is 30.4 percent. This is a sizeable jump from our initial report last year of 22.8 percent.
This industry has been recognized for being “green” before being green was cool, and that trend continues. Fewer heads are being scrapped each year – we found that 18 percent of diesel heads and even fewer aluminum heads (14.9 percent) are being scrapped. But when they’re repaired, rebuilders continue to leave the work to the experts. Our survey results indicate that half of respondents say they do aluminum cylinder head crack repairs themselves and only 25 percent do their own diesel head repair.
It’s interesting to look at HOW?cracked cylinder heads are repaired. On aluminum heads, cracks are welded 77 percent of the time. For diesel heads, welding is performed 41 percent of the time. Pinning remains the most-often used method for repairing cast iron cylinder heads, but the number has declined. last year, welding was performed just 14 percent of the time.
The national average number of gas and diesel crankshafts reground monthly by the typical CER rebounded with gusto, climbing from 19.6 units in 2009 to 27.5 in 2010. These increases were seen in nearly every category.
Diesel crank production increased in 2010 compared to 2009, rising from 3.1 to 6.4 total units per month. Gasoline crankshaft regrinding jumped 21 percent, going from almost just under 17 total units produced monthly during 2009 to 21 total units produced in 2010.
These gains are, as we’ve seen in other segments, higher than in years past and can likely be attributed to the fact that today’s shops have become better marketers and more efficient producers.
According to the AAIA’s 2012 Digital Aftermarket Factbook, total registrations of U.S. new light vehicles rose 10.6 percent in 2010 to 11.5 million, a reversal from heavy losses experienced in 2009 (down 21.4 percent) and 2008 (down 17.7 percent). AAIA blames several factors for these declines, including the Great Recession and the struggles that the U.S. auto industry went through.
These new car sales figures don’t spell doom for the aftermarket, however, AAIA is quick to reassure us. While new car sales rose, the total population of registered motor vehicles fell 0.6 percent, to 248.6 vehicles. “On the whole, Americans are holding onto their vehicles longer now than ever before; a very strong indicator for the American aftermarket,” comments the Factbook. “For the first time, the average age of passenger cars reached 11 years. Light truck longevity increased one-half year, to 10.1 years. On average, light vehicles are lasting one year longer than five years ago and almost two years longer than 10 years ago.”
The combination of older vehicles and expectation of greater consumer confidence has AAIA predicting U.S. Automotive aftermarket growth of about 4.2 percent in 2010, followed by continued growth of 4.1 percent in 2011 and 2012, growth of 2.9 percent in 2013 and 2014 growth of 3.5 percent.
Forecasting growth, planning for future markets and equipping to meet tomorrow’s technology needs, means engine builders need to regularly take stock of their equipment situation. Some continue to express reluctance to take a chance on used equipment. 2010 Survey respondents say 43.5 percent of their purchases were of new equipment and 56.5 percent of equipment was used. In 2009 the numbers were 60.2 percent new and 39.8 percent used.
The previous year’s numbers showed positive trends in the equipment purchasing arena, so it might be natural to expect fall-offs this year. After all, this equipment can be expensive and is designed to last a long time in very rough environments.
However, the average amount spent on shop equipment in 2010 was $18,400, a huge bump over a 2009 figure of $10,566. In fact, this survey reflects the largest increase we’ve seen immediately following a strong decrease the year before.
Shops indicate that the present value of their equipment (including depreciation) is a whopping $223,000, reflected, we believe in the resurgence of larger shops to this survey. This number is nearly a 25 percent increase over 2009’s already strong showing.
Shops indicated that the average age of their equipment is around 15.6 years old, slightly older than the average age the year previous – an aging trend that makes perfect sense if you think
about it!
Our survey results show that several types of equipment remain of interest for purchase in 2011.
According to our survey, popular items on our respondents’ shopping lists include aqueous cleaning equipment, aluminum head welding equipment, engine balancing equipment, head and block resurfacers, micropolishing equipment, valve refacers and valve seat grinding/cutting equipment. About 3 percent of shops are likely to purchase these machines this year, while 9 percent of shops are likely to purchase a valve seat and guide machine.
Major equipment purchases last year included aqueous and solvent cleaning equipment, crankshaft polishers, cylinder honing machines, electrical testing equipment, engine balancers, head and block resurfacers, lathes, pressure testing equipment, spray washers, seat and guide machines and valve refacers.
In most cases, shop owners say they’re spending less time performing many of the necessary tasks to doing a complete engine build than last year – but only marginally so. Disassembly and cleaning, block resurfacing, cylinder head crack repair, connecting rod reconditioning, valve reconditioning and crank grinding, polishing and welding, all take a little less time, while cylinder boring, cylinder head resurfacing, valve guide and seat work, flywheel grinding and “other” services take a slightly greater portion of the typical day.
A complete downloadable version of this report can be found online at www.enginebuildermag.com. Part 2 of the Machine Shop Market Profile – which includes additional information on financial data, employee information and customer base analysis of the typical CER/machine shop compared to the national average – will be presented in July.
To download the accompanying charts, please click here.