When life starts handing out lemons, say the feel-good self-help gurus, the smart money is on the person who not only makes lemonade but figures out a way to sell it for a profit. While the readers of Engine Builder might be hard-pressed to find time to manage a lemonade stand, the analogy still applies: in difficult times, you do what you have to do to remain competitive.
As we’ve reported in the past, that means a newfound appreciation for the niche markets in an engine builder’s area. The challenges continue to be significant but so does the resolve.
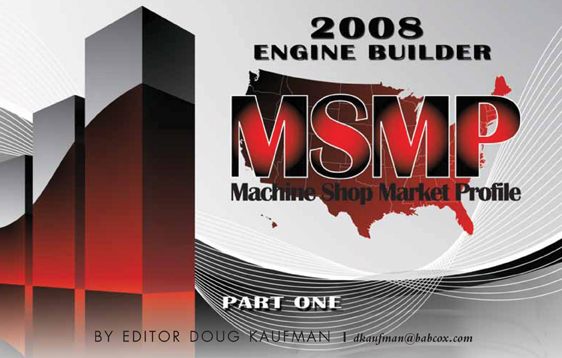
Engine Builder magazine’s annual survey of machine shops – presented this month and next as the Machine Shop Market Profile – may be the single constant in this business. For more than 20 years, we have surveyed the same machine shop/custom engine rebuilder (CER) population to get not only the raw numbers but in some cases, the raw emotion of an industry continuing to adapt to changing times.
Because of the decades of data we’ve collected, we believe the information in this study is the most reliable data available for tracking trends in the production of engines, cylinder heads and crankshafts, as well as specific business data.
The data generated for this year’s Machine Shop Market Profile was collected through survey questionnaires sent to the machine shop/custom engine rebuilding membership of the AERA. Four different questionnaires, consisting of four pages each, were developed to obtain the information contained in our profile.
Each questionnaire was mailed to one-quarter of AERA’s rebuilding membership, selected on a random-start Nth-name basis. A total of 2,150 appropriate usable outgoing questionnaires were sent out in early January.
A total of 267 completed questionnaires were returned, resulting in a return rate of 12.4%. Analysis of the data was completed by Babcox Market Research.
The survey information reflects data for production year 2007. Part I of this two-part profile includes data on monthly production of engine blocks and cylinder heads, broken out by engine size as well as by gas and diesel configurations, as well as crankshafts, core sourcing, shop equipment ownership and purchasing, and total production time spent in specific engine building areas.
As we have reported, the challenges facing this industry continue to mount. When the conventional wisdom tells you that it might be better to get out of the business and sell real estate on the Internet, Engine Builder readers continue to build and sell engines for two very simple reasons: because they enjoy doing it and because they’re good at it.
“Sure, I could probably make more money and have less hassle doing something else,” one engine builder told me recently, “but every job has its hassles…and I really like what I do.”
So, adjustments are made. Whether it is in the type of engine built, the source of parts or the method of business operation, our readers soldier on, ready to face the music.
And if you’ve been in this industry for any length of time, you’ll recognize that concerns are no longer limited to local competition. Rising oil prices, a weak dollar, a slumping housing market and the overall consumer credit crunch have combined into a swamp that concerns not only customers but business owners as well. The negatives aren’t only happening to “them” – they’re happening to “us.”
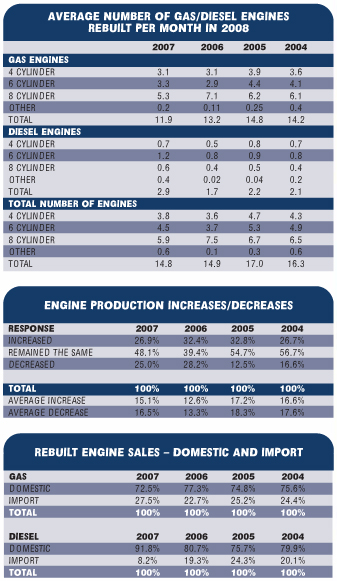
And yet, with all the problems facing us, there are positives to report. In fact, after suffering a decline of more than 12 percent during 2006 compared to 2005, the total number of engines built per month in 2007 stayed almost steady.
Nationally, the numbers look like this: the average machine shop produced about 15 gas and diesel engines monthly last year, compared to virtually the same number in 2006.
While the number of four-cylinder gas engines built remained steady and six-cylinder engines actually increased 14 percent in 2007, the number of eight-cylinder engines slumped 25 percent, from 7 per month to slightly more than 5 per month.
The increase of 82 percent in “other” gas engines produced is an exciting statistically, but because it’s an increase of an average of .1 engine per month to .2 engine per month, it’s hard to get too worked up about the growth. Overall, gas engine production was down 10 percent in 2007.
In the diesel segment, however, it’s very easy to see the impact, and in talking to both shops and suppliers, it’s a very real trend. Across the board, the number of diesel engines produced was up 71 percent in 2007 from 2006, and was at its highest level since 2003.
A segment that fell back slightly in 2006 after gains in the previous several years – diesel engines – improved significantly in 2007. The number of diesel engines produced each month climbed from 1.7 units per month in 2006 to 2.9 per month in 2007. Solid gains in the number of four-, six- and eight-cylinder engines are responsible, offsetting the decline in gas engines.
Sadly, this goes in the opposite direction of what we reported last year, when domestic V8s seemed to be unstoppable. But looking at other things that have changed since last year, that is understandable. At the end of 2006, when the theme of the Specialty Equipment Market Association (SEMA) Show was “Celebrating the past, present and future of American Muscle,” the National average for gasoline was around $2.10 per gallon.
That level jumped quickly to over $3.00 per gallon in 2007 and now stands 82 cents per gallon more than it did last year. Alternative fuels and diesel are getting much more of a look in many parts of the country.
The average national monthly gas and diesel engine production of nearly 15 units translates to 180 engines produced annually. This compares to annual production of 221 engines produced during 2005 for the typical custom engine rebuilder.
Projected onto a universe of 4,000 to 6,000 full-service machine shops, it’s estimated that CERs accounted for between 720,000 to 1.08 million gas and diesel engines built during production year 2007, the same as it was in 2006. During production year 2005 the national average for the CER market in gas and diesel engine production ranged between 840,000 and 1.28 million units.
If you add in the estimated 600,000 engines remanufactured annually by the approximately 40 U.S. production engine remanufacturers (PERs), the combined total number of engines rebuilt in 2007 by CERs and PERs would be approximately 1.32 million to 1.68 million units. This compares to approximately 1.52 million to 1.92 million engines produced by PERs and CERs during production year 2005.
At an average retail cost of approximately $2,600 per engine, we speculate that, even in a challenging, difficult business, the total rebuilt/remanufactured engine market generated between $3.43 billion and $4.37 billion in rebuilt engine sales in 2007.
Stemming the tide of decline is a good thing, and the fact that the numbers stayed even can be seen as positive. “The numbers certainly aren’t going up,” one rebuilder lamented. That certain segments actually improved since our last survey was completed is a victory, especially viewed in the light of the rest of the manufacturing industry.
According to a March 28, 2008 report on our sister publication AftermarketNews.com, Tony Cristello, an analyst from BB&T Capital Markets said this about the dual-pronged problems facing many CERs and PERs these days: “Spikes in raw material prices have placed considerable pressure on aftermarket suppliers as these companies attempt to pass along the higher input costs through price increases; in addition, we believe that sluggish end-user demand has led many auto retailers and service shops to adopt a leaner approach with regard to inventory levels, creating some revenue headwind for manufacturers given fewer subsequent replacement orders.”
Not only does it cost more to buy the parts to rebuild the engines, the engines you might sell to installers for stock are getting harder to move as well.
For that reason it’s easy to see that rebuilders continue to look toward other types of engines to keep their equipment and employees active. Looking at the different segments of engines rebuilt by CERs, typical automotive gas units slumped nearly 13 percentage points to account for just over 37 percent of total engine production.
Automotive diesel also declined slightly but one can expect that number to start rebounding soon, especially with new diesel engines being introduced.
On a national basis, combined gas and diesel cylinder head production decreased over 9 percent, dropping from a total of 55 units rebuilt monthly in 2006 to 50 units rebuilt monthly in 2007.
Gas head production fell about 8 percent, going from 46.3 units monthly in 2006 to 42.4 units produced last year. Six- and 8- cylinder head rebuilding both declined in 2007, although 4-cylinder head rebuilding production rebounded slightly in 2007 compared to 2006, though not to the level it was even two years ago. “Other” cylinder heads (likely small heads for kart motors or other types of small engines) actually saw a 33 percent increase.
Diesel heads rebuilt monthly saw an even more dramatic decline, but not as great as last year’s. Total diesel cylinder head production fell from 9.1 units rebuilt monthly in 2006 to 7.8 units in 2007. Four-, 6- and 8-cylinder diesel head production all showed declines, of 25, 10 and 6 percent respectively.
The percentage of cylinder head rebuilding that is aluminum declined in 2007. In 2006, 55.8 percent of cylinder head work was done in aluminum; in 2007, 48.4 percent of repaired cylinder heads were aluminum, which actually matches the 2005 level.
General Motors still dominates in the cylinder head rebuilding market according to our survey respondents. When asked what the number one aluminum head rebuilt in their shop was, about 47 percent named a GM product. The most common General Motors head remains a tie – the GM 3.1/3.4L and the 2.0/2.2L are essentially dead even as the most common heads from The General being rebuilt.
Toyota slipped slightly from its solid second place standing in 2007, as 13 percent of shops indicated that Toyota heads were the number one aluminum head rebuilt in their shops in 2007 down from 16 percent in 2006.
“Other” types of cylinder heads climbed into a second-place tie with Toyota from their sixth-place standing last year. Ford saw a modest decrease in 2007, falling a percentage point from the previous survey. Chrysler’s popularity, too, declined, with 7 percent of rebuilders naming Mopar Number 1.
Honda and Mitsubishi each held their positions according to 2007 survey respondents. Honda was ranked Number 1 by 7 percent of rebuilders and while some shops are rebuilding the Mitsubishi brand, it was not named as No. 1 by any shop.
After several years of holding onto cylinder heads, rebuilders told us that in 2006 they scrapped more than one-third of cylinder heads. It seems like the recycling ways are returning, because in 2007 less than 27 percent of heads were scrapped. This is even less than in 2005 when slightly more than 27 percent of heads were scrapped.
But in 2007 rebuilders said they do fewer of the repairs themselves. Our survey results indicate that 43.4 percent say they do aluminum cylinder head crack repairs themselves while 56.6 percent say they send the heads out for repair.
Performance-related cylinder head work continues to increase, according to our survey, with gains coming at the higher end of the scale. The percentage of respondents who say that more than 70 percent of their head work is performance related increased by 6.5 percentage points in 2007. The percentage of shops who say performance makes up 51-70 percent of their total production volume increased 6.4 percentage points.
The national average number of gas and diesel crankshafts reground monthly by the typical CER declined for the first time in 3 years, from 24.6 to 20.2 units in production year 2007.
Gas and diesel crank production both saw declines in 2007 compared to 2006. Reground gas cranks fell about 12 percent going from 19.7 to 17.3 total units, while diesel crankshaft regrinding fell about 41 percent, going from almost 5 total units produced monthly during 2006 to just under 3 total units produced in 2007.
Gas crankshaft production fell in all engine size categories, but the 6-cylinder and 8-cylinder sizes fell the least. Diesel crankshaft production also decreased in most engine sizes. However, “other” diesel crankshafts saw a statistically huge 100 percent increase.
According to shops with whom we’ve spoken, the availability of cores, including cylinder heads and crankshafts, continues to be a challenging part of today’s engine building business. By far, customer returns account for the majority of engine cores used, but that number fell in 2007 by about 6 percentage points.
In the case of engine cores, customer returns accounted for 54.4 percent of the cores; in 2006 that number was 60.6 percent. Core suppliers accounted for 14.3 percent of cores; in 2006 they supplied 12.3 percent of cores.
Salvage yards, which had been falling in either their importance to or availability for engine builders were responsible for 16.4 percent of cores sourced; in 2006 that number was 8.6 percent, down from 13.9 percent in 2005 and back in 2004 it was 16.2 percent. Salvage yards selling relatively low mileage used engines to consumers or installers are serving rebuilders too. New castings were responsible for 14.9 percent of engine cores.
For cylinder head acquisitions, the numbers are similar. In 2007, customer returns accounted for 56.3 percent of the cores. Core suppliers accounted for 13 percent of the cylinder heads in 2007. New castings were responsible for 17.9 percent of the castings last year. Salvage yards held their 2006 level of 12.8 percent in 2007.
The question of appropriate shop equipment is always a challenge, because wanting the latest and greatest and justifying it can be two entirely different things. Counter today’s emphasis on shop survival with the need to meet increasingly strict tolerances and shop owners are often hard-pressed to determine whether new equipment will help or hinder the bottom line.
In 2006, we were warned that shop owners seemed reluctant to make new equipment purchases. Although early 2007 equipment sales held promise that this prediction would be unfounded, the numbers from our survey indicate otherwise.
The average amount spent on shop equipment in 2007 was $11, 548, and discussions with salespeople for large equipment suppliers indicate that its as challenging as ever to put new equipment into shops and subsequently service those machines.
Shops indicated that the average age of their equipment is less than 15 years old, signalling that they have replaced aging machines with new or younger used equipment sometime in the past. The good news, however, is that survey respondents say several types of equipment remain of interest for purchase in 2008.
According to our survey, popular items on our respondents’ wish lists include crack detection equipment (6 percent say they are likely to purchase in the next year; valve guide and seat machines and block line boring equipment (each on the radar of 5 percent); blasting equipment (4 percent); as well as a number of other types of equipment that 3 percent of respondents say they’ll buy.
Predictions about the state of the U.S. economy change daily. Normally, the economy improves in an election year. Economic stimulus checks have been delivered to more than 130 million households. Good news, right?
Well, according the AftermarketNews.com report cited earlier, the National Association of manufacturers has cautious optimism for the economy as a whole.
In NAM’s February 2008 “State of the U.S. Economy and Manufacturing Report,” the association writes: “…Economic growth will likely turn negative in the first quarter of 2008, followed by stalled growth in the second quarter and then pick up to modest growth in the second half of this year.”
NAM’s report shows that after 1.8 percent growth in 2007, the manufacturing sector will slightly outpace the overall economy and grow by 1.5 percent in 2008. The industries expected to lead the manufacturing sector in 2008 are mostly export-oriented – aerospace, computers and electronic products, machinery, chemical producers and medical equipment
Unfortunately, industries closely connected with the housing market and consumer purchases (including motor vehicles) are expected to deteriorate in 2008, according to NAM.